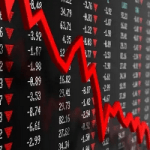
 The Shiller’s cyclically adjusted price-to-earnings (CAPE) ratio for the S&P 500 is currently 34.66. This is representative of a stock market that has lost all touch with reality. It even exceeds the 31.48 CAPE ratio hit in 1929, just before the stock market crashed and the onset of the Great Depression.
But it’s not the highest it has ever been. There are two instances when the CAPE ratio has been higher than today. December 1999 – at the height of the dot com bubble, just before the crash – when the CAPE ratio hit 44.19. And October 2021, when the CAPE ratio reached 38.58.
For clarification, the CAPE ratio looks at the price of stocks relative to their average earnings, adjusted for inflation, over the past 10 years. This provides a big-picture view, which smooths out the year-to-year swings in earnings.
According to the CAPE ratio for the S&P 500, today’s stocks are super-duper expensive. This doesn’t mean they will crash tomorrow. In fact, they could become even more expensive. What it means is, at today’s prices, stocks are very risky in terms of any potential reward they may offer.
As the U.S. economy slows into summer, and inflation remains elevated, there’s an increasing likelihood we could find ourselves in a period of stagflation. Where the economy is characterized by both rising unemployment and rising consumer price inflation.
With stocks at extreme valuations, a slowing economy and associated credit crisis could be the pin that finally pricks the bubble. Perhaps stocks decline 20 to 30 percent to close out the year. Maybe more. Regardless, the actual loss will be masked by inflation.
Still, the central planners pretend they don’t see it…
Theoretical Contradiction
Federal Reserve Chair Jerome Powell recently dismissed the idea of stagflation. He said he doesn’t see “the ‘stag’ or the ‘flation’.” This is the same guy that kept saying inflation was “transitory” in 2021 when it was running up to a 40-year high.
Powell, no doubt, only looks at government fabricated data and statistics for evidence of economic conditions. He’s missing the forest for the trees. A cross country road trip would open his eyes. So would a look back to the not-so-distant past.
In the late-1970s, for example, inflation and unemployment simultaneously went vertical. According to the leading economists, this was supposed to be impossible. Their academic training said so.
The Phillips curve illustrated that there’s an inverse relationship between inflation and unemployment. When unemployment goes down, inflation goes up. Conversely, when unemployment goes up, inflation goes down.
Nowhere does the Phillips curve show inflation and unemployment both going up at the same time. These two variables, in theory, were supposed to be mutually exclusive.
When economist William Phillips first sketched his curve using wage rates and unemployment data in the UK in the years 1861 to 1957, the depiction of explicable order was impressive. Moreover, his curve provided an economic model central planners could use to somehow optimize inflation and unemployment rates through economic intervention.
But by the late-1970s too much monetary intervention by the Fed and too much deficit spending by Congress had pushed reality to a place of theoretical contradiction. When unemployment began creeping up in the 1970s, Congress, with backing from the Fed, did what Keynes had told them to do. It ran deficits to stimulate the economy and spur jobs creation.
Rendered Useless
Per the tenets of the Phillips curve, with rising unemployment the central planners could have their cake and eat it too. They could print money and increase deficit spending without increasing consumer price inflation.
Yet something entirely unexpected happened. Instead of stimulating jobs, the stimulus stimulated inflation. Then, when they applied more stimulus, they still didn’t get jobs. Rather, they got more inflation.
Phillips’ study will forever stand as a shining example for why economic theory cannot be derived from empirical data. There are too many variables at play. The 1970s experience took Phillips’ deliberate curves and twisted them inside out.
The 1970s episode of rising inflation and high unemployment also demonstrated the economy is hardly predictable. One decade people will borrow money and spend it. The next, they will save and pay down debt. No graphical curve can predict what way people’s behavior will swing from one period to the next.
This also showed that any pre-1971 dataset used to discern a relationship between inflation and unemployment had been rendered useless. After the last traces of gold were removed from the monetary system when Nixon closed the gold window, their relationships could be distorted beyond recognition.
Logically, when the unemployment rate goes up the economy sinks. Shouldn’t this drive the inflation rate downward?
Contrary to the experience of the late-1970s, this is what the planners at the Fed are counting on. They’re banking on a soft economy to slow the rate of consumer price inflation to within their arbitrary 2 percent target.
But they’re also trying to postpone this until after the election to boost Biden’s odds. Powell knows that he’ll be given a pink slip if Trump wins.
This Inflation Script Won’t Last
This week’s CPI report showed consumer prices increased 0.3 percent in April and at a 3.4 percent rate over the last 12 months. This 3.4 percent annual CPI increase reported in April is 70 percent higher than the Fed’s arbitrary 2 percent inflation target.
At a 3.4 percent annual inflation rate, the purchasing power of the dollar halves every 15 years. But we don’t need to look back nearly that far to see signs of extreme dollar debasement.
Just since March 2020, when the government shut down the economy and supplied trillions of dollars of printing press money, the CPI has increased from 258.115 to 313.548. That’s an increase of 21.5 percent.
Yet, Wall Street took the latest CPI reading as an indication the Fed will cut rates this year. Following the report, the DOW, S&P 500, and NASDAQ all posted record closing highs. On Thursday, the DOW briefly topped 40,000 for the first time ever. What’s going on?
In short, this fabricated CPI data was scripted to align with the Fed’s plans. By telegraphing rate cuts the Fed is getting the higher stock prices Washington needs. Because inflated stock prices serve to inflate government tax revenues.
With net interest on the debt rapidly approaching $1 trillion per year, Washington needs all the capital gains taxes it can get. That’s why President Biden wants to jack capital gains taxes up to 44.6 percent. A stock market decline will take away this source of revenue, which will make the fiscal picture even uglier.
The inflation and interest rate script may be unfolding as the planners intend, for now. But that doesn’t mean the economy isn’t slowing and that we’re not slipping into a new period of stagflation. These realities will overwhelm the script soon enough.
A slowing economy, rising unemployment, and a declining stock market in the face of $2 trillion in deficit spending will not slow the rate of consumer price inflation, as the Fed’s Phillips curve zealots expect. Rather, it will exacerbate it.
Declining income tax and capital gains tax revenues, along with renewed stimulus, will push deficit spending higher…along with consumer price inflation.
[Editor’s note: It all started roughly 25 years ago in a world both very similar and different than today. This awareness is important if you desire to use economic recessions to build investment wealth. And if you’ll give me a moment, I’d like to share my story with you. >> Click Here, to discover how to use recessions to build investment wealth.]
Sincerely,
MN Gordon
for Economic Prism
Return from This Inflation Script Won’t Last to Economic Prism


Inflation will continue full speed ahead or faster because government won’t stop borrowing and pay down their debt and real estate investors won’t stop trying to get rich on real estate by driving up prices causing more debt. The greater fools pandering to the greed of real estate investors won’t quit bidding up the prices either because they expect low interest rates and an unlimited supply of greater fools to make them rich also. This idiotic state of affairs will end in a new dark age or worse. In a closed system like a mouse utopia experiment it ends in extinction every time.
You assume Powell is incompetent and not that he is evil. And that at your, and your readers’, own risk.